If you’ve ever bought Bitcoin at the top and watched it drop 50% in a month, or sold too early during a crash only to see it double a year later, you’ve felt the raw emotion of a crypto market cycle. These aren’t random spikes or crashes - they’re repeating patterns. And while they’ve changed over time, they still follow a rhythm most traders ignore until it’s too late.
What Exactly Is a Crypto Market Cycle?
A crypto market cycle is the full swing from despair to euphoria and back again. It starts when prices crash hard, and most people give up. Then, slowly, a few smart buyers start accumulating. Prices crawl sideways for months. Then, out of nowhere, momentum builds. Prices explode. Everyone rushes in. Greed takes over. And then - boom - it all collapses again.
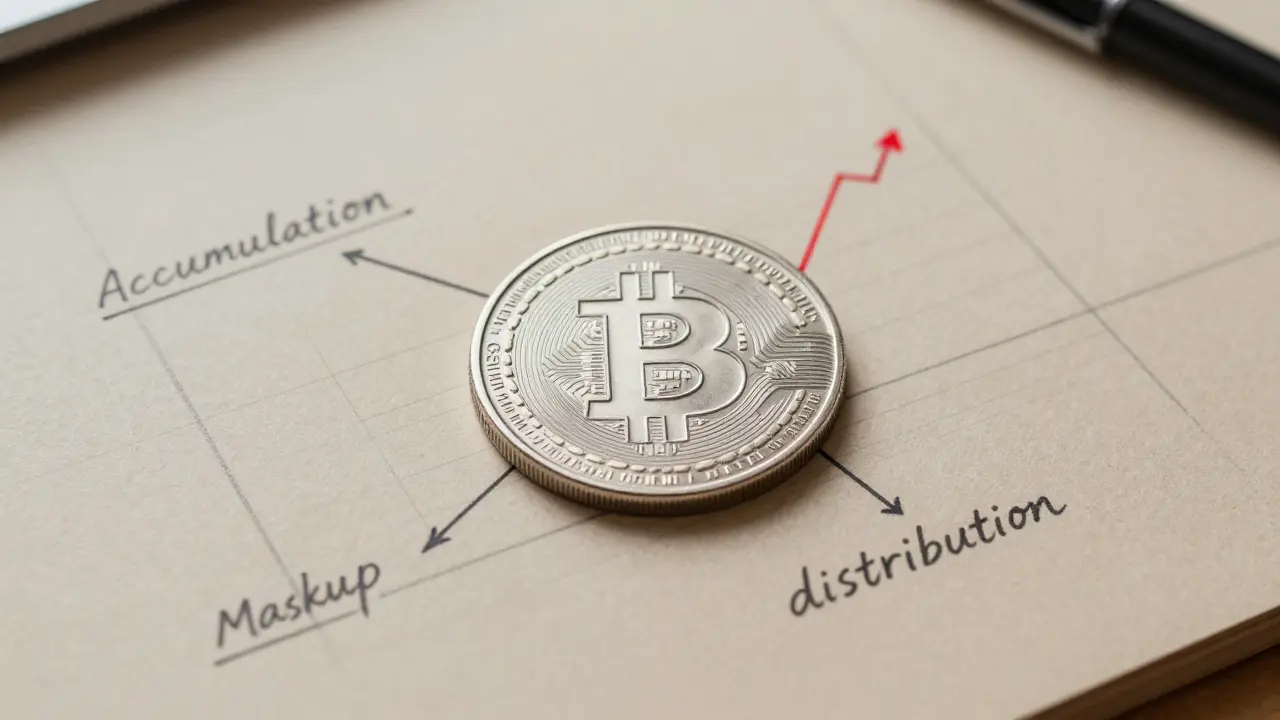
This isn’t magic. It’s human behavior. And it’s been happening since Bitcoin’s first major price run in 2011. The pattern is clear: accumulation → markup → distribution → markdown. Each phase has telltale signs you can spot if you know what to look for.
The Four Phases of Every Crypto Cycle
Every cycle, no matter how different it feels, moves through these four phases.
1. Accumulation: The Quiet Phase
This is when the market is dead. Prices sit in a narrow range - often within 15% of each other - for six to twelve months. Volume drops. Social media goes quiet. Most people think crypto is dead.
But behind the scenes, big players are buying. On-chain data shows wallet addresses accumulating Bitcoin in bulk. The Crypto Fear & Greed Index hovers between 20 and 30 - pure fear. In 2020, after the March crash, Bitcoin traded between $3,800 and $5,200 for eight months. Nobody talked about it. But those who bought then made 10x by 2021.
Key signs: Low trading volume, stable price, Fear & Greed Index below 25.
2. Markup: The Slow Burn Turns to Rocket Fuel
This is where most people miss the boat. The first 30% rise doesn’t feel like much. But then it accelerates. Bitcoin goes from $5,000 to $20,000. Then $40,000. Then $60,000. Trading volume spikes 300-500%. The Fear & Greed Index climbs into the 70s and 80s.
During the 2020-2021 cycle, Bitcoin rose from $5,000 to $69,000 in 18 months. That’s a 1,280% gain. People started buying because their friends were making money. Crypto Twitter exploded. You saw memes. You saw influencers. You saw FOMO.
Key signs: Rising volume, breaking previous highs, Fear & Greed Index above 70.
3. Distribution: The Bubble Stage
This is the most dangerous phase. Prices go parabolic. Bitcoin hits $100,000 - then $120,000. Daily swings hit 10%. News outlets run headlines like “Bitcoin Will Replace Gold.” Retail investors max out credit cards. Exchange deposits spike. Whale wallets start moving coins to exchanges.
Here’s the truth: When the price moves too fast, too far, too soon - it’s a sign the smart money is selling. In 2021, Bitcoin peaked at $69,000. By November 2022, it had crashed to $15,476. That’s a 77.6% drop. The bubble didn’t burst because of bad news. It burst because everyone who was going to buy, already did.
Key signs: Extreme volatility, mass media hype, rising exchange reserves, Fear & Greed Index above 85.
4. Markdown: The Crash and the Reset
This phase isn’t just a correction. It’s a purge. People panic-sell. Trading volume spikes at first as everyone tries to exit. Then it drowns. Wallets stop moving. The Fear & Greed Index drops below 15 - extreme fear.
The 2022 crash saw Bitcoin fall 77% over 12 months. But here’s what most don’t realize: The bottom isn’t when it hits $15,000. It’s when it stops falling. That’s when accumulation begins again.
Key signs: Volume drying up, Fear & Greed Index below 20, long-term holders refusing to sell.

The Bitcoin Halving: A Myth or a Mechanism?
For years, the story was simple: Bitcoin halves every four years. Supply drops. Price goes up. It worked in 2012, 2016, and 2020. After the 2020 halving, Bitcoin went from $9,000 to $69,000. It looked like a law of nature.
But the 2024 halving changed everything.
Bitcoin’s price went from $42,000 to $118,000 in just two months. Then it dropped back to $75,000 by November 2025. That’s a 35% pullback from the peak - nowhere near the 450% surge of 2020. This wasn’t a repeat. It was a rewrite.
Why? Because the market isn’t the same. In 2017, 95% of Bitcoin trading was done by retail investors. Today, institutional players - ETFs, hedge funds, pension funds - control 35% of daily volume. That’s up from 5% in 2017. These players don’t trade on hype. They trade on data. And they smooth out the spikes.
The halving still matters. But now it’s just one factor - not the whole story.
Why the Cycles Are Changing - And What It Means for You
The crypto market isn’t a wild frontier anymore. It’s becoming a financial asset class. And that changes everything.
- Spot Bitcoin ETFs - Approved in January 2024 - brought in $22 billion in assets within 18 months. These funds don’t buy on FOMO. They buy on schedule. That reduces volatility.
- Algorithmic trading now makes up 65% of crypto volume. Bots react faster than humans. They amplify moves - but also reverse them quicker.
- Regulation - Especially the EU’s MiCA framework - is forcing exchanges to comply. That means less pump-and-dump, less anonymous trading.
Result? Cycles are getting shorter. The 2012-2016 cycle lasted 48 months. The 2020-2024 cycle lasted 32 months. Analysts now expect the next cycle to be just 24-30 months.
And amplitude? It’s shrinking. The 2014 crash wiped out 89% of Bitcoin’s value. The 2022 crash wiped out 77%. The 2025 correction? Only 35% from peak. The market is maturing. The crashes aren’t as brutal. But the rallies aren’t as explosive either.
How to Use This Without Getting Burned
Knowing the cycle isn’t enough. You need a strategy.
1. Use dollar-cost averaging (DCA) - Buy a fixed amount every week, no matter the price. During accumulation, you build position. During euphoria, you’re already in. DCA outperformed lump-sum buying by 22% in the 2020-2021 cycle, according to Swan Bitcoin’s 2025 report.
2. Watch on-chain data - Tools like Glassnode and CoinMetrics show you what whales are doing. Look at:
- MVRV Z-Score - Tells you if Bitcoin is overvalued or undervalued.
- NUPL (Net Unrealized Profit/Loss) - Shows how many holders are in profit. Above 0.7? That’s a warning sign.
- SOPR (Realized P/L) - If people are selling at a profit, they might be exiting.
3. Don’t ignore sentiment - The Crypto Fear & Greed Index still works. If it’s below 20, it’s a good time to buy. If it’s above 80, it’s time to sell - even if the price keeps going up.
4. Limit your exposure - Never put more than 5-10% of your total portfolio into crypto. Even in a bull market. The next crash will still hurt if you’re over-leveraged.
5. Ignore the noise - If you’re checking Twitter every hour, you’re not investing. You’re gambling. Cycle-based investing is a long game. It’s patience. It’s discipline.
Bottom Line: The Cycle Is Still Real - But You Have to Adapt
The crypto market still cycles. The fear and greed are still there. But the game has changed. The old 4-year halving model doesn’t work like it used to. The crashes aren’t as deep. The rallies aren’t as wild. And timing the top? Forget it.
The smartest move now isn’t trying to predict the next peak. It’s building a system that works no matter the phase. Buy small. Stay consistent. Use data, not emotion. And remember - every bear market ends with a bull. But only if you’re still holding when the dust settles.


Cheryl Fenner Brown
20 February, 2026 . 15:31 PM
omg this is so spot on 😍 i bought btc at 42k before the halving and cried when it dropped to 75k... but now i'm just dcaing like a champ 📈💰
Michael Teague
20 February, 2026 . 15:53 PM
lol another guy who thinks he knows the market. you didn't even mention how much of this is just fed policy. crypto cycles are just a distraction from real inflation.
kati simpson
20 February, 2026 . 22:03 PM
i think the key thing is just staying consistent and not getting emotional about it. i've been buying a little every week since 2021 and honestly i don't even check my portfolio anymore. it just works if you let it
Cory Derby
22 February, 2026 . 18:03 PM
Thank you for this comprehensive breakdown. The structural shift from retail-driven volatility to institutional participation is a critical evolution. One must recognize that algorithmic liquidity and regulatory clarity are not merely supplementary factors-they are foundational to the new paradigm of digital asset valuation.
lori sims
23 February, 2026 . 20:15 PM
this whole thing feels like watching a dragon sleep then suddenly sneeze fire then pass out again 🐉💤 i love how chaotic but predictable it is. like a weird emotional rollercoaster that somehow always ends with free coffee at the bottom
Reggie Fifty
25 February, 2026 . 01:38 AM
you people act like crypto is some new thing. in 1987 we had the crash. in 2000 the dotcom bubble. this is just capitalism doing what it does. stop romanticizing gambling.
Kaitlyn Clark
25 February, 2026 . 14:32 PM
dca is literally the only way to go 🤗 i used to try to time it and lost so much... now i just throw $20 in every friday like clockwork. no stress. no drama. just btc piling up. also i use coinbase so yeah lol
christopher luke
27 February, 2026 . 11:24 AM
this gave me so much hope 💪 i was ready to quit crypto after the 2022 crash but reading this reminded me why i started. every bear market is just a setup for something bigger. keep going!
Nadia Shalaby
28 February, 2026 . 14:30 PM
honestly i just scroll past all this and buy when i see a meme that makes me laugh. works better than any indicator tbh
Shannon Black
1 March, 2026 . 04:52 AM
The structural evolution of cryptocurrency markets toward institutional integration necessitates a reevaluation of traditional cycle models. The convergence of regulatory frameworks, ETF liquidity, and algorithmic trading protocols has fundamentally altered the temporal and amplitude dynamics of price formation.
Richard Cooper
2 March, 2026 . 04:35 AM
i bought at 70k sold at 60k then bought back at 40k now its at 75k and i still feel like an idiot
Megan Lavery
3 March, 2026 . 09:20 AM
dca saved my sanity. and yes the halving thing is still kinda magic. not because of supply but because it gives everyone a reason to buy again. it's like a holiday for crypto nerds 🎄
Mae Young
3 March, 2026 . 20:55 PM
Oh, so the 'cycle' is real? Wow. And I thought it was just a marketing gimmick created by people who needed to sell newsletters. The 'four phases'? That's just a PowerPoint slide someone made while high on kombucha.
Trenton White
5 March, 2026 . 03:48 AM
The institutional adoption trend is undeniable. However, one must also consider geopolitical factors and the potential for sovereign digital currency integration. Crypto is not operating in isolation.
Michelle Mitchell
6 March, 2026 . 12:31 PM
i read this and still dont know if i should buy or not. maybe i just need to sleep on it
Mary Scott
7 March, 2026 . 02:33 AM
this is all a fed psyop. they want you to think crypto is a cycle so you keep buying while they print trillions. watch the banks buy up all the btc then crash it when they're done. they control everything.
Shannon Holliday
8 March, 2026 . 07:37 AM
i love how crypto is like a global party and everyone shows up at different times 🌍🎉 sometimes you're the first one there, sometimes you're the last one dancing. but the music never really stops
Jeremy buttoncollector
10 March, 2026 . 02:46 AM
The NVT ratio remains underutilized in retail discourse, and the S2F model's logarithmic decay curve is being systematically distorted by ETF inflows and macro hedge fund rebalancing. We are witnessing a paradigmatic shift from scarcity-based valuation to yield-integrated asset pricing.
Michelle Xu
11 March, 2026 . 19:40 PM
I appreciate the depth of this analysis. For newcomers, I recommend starting with small, automated investments and focusing on long-term metrics like MVRV and NUPL. Emotional detachment is not optional-it is the cornerstone of sustainable participation in this space.