Most people think buying Bitcoin and Ethereum is enough to diversify their crypto portfolio. They aren’t. If both assets move up or down together, you haven’t actually spread your risk-you’ve just doubled down on the same market forces. This is where cryptocurrency correlation comes in. It’s not just a fancy math term; it’s the single most important metric for understanding whether your digital asset holdings are truly independent or if they’re all tied to the same string.
Correlation measures how two assets move in relation to each other. A high positive correlation means when one goes up, the other likely will too. A low or negative correlation suggests they move independently, which is exactly what you want for stability. In this guide, we’ll break down how to calculate these numbers, why simple methods often fail in volatile markets, and how you can use this data to build a stronger, more resilient portfolio.
What Is Cryptocurrency Correlation?
At its core, correlation is a statistical measure that shows the degree to which two variables move in tandem. In finance, we use the correlation coefficient, usually denoted as r. This number ranges from -1 to +1.
- +1 (Perfect Positive Correlation): The assets move in perfect lockstep. If Bitcoin rises 5%, the other asset also rises 5%.
- 0 (No Correlation): There is no relationship between the price movements of the two assets.
- -1 (Perfect Negative Correlation): The assets move in opposite directions. When one goes up, the other goes down by a proportional amount.
In the crypto world, true negative correlations are rare. Most cryptocurrencies tend to have positive correlations because they are influenced by similar macroeconomic factors, such as interest rates, liquidity conditions, and general investor sentiment. However, the strength of that correlation varies wildly depending on the timeframe and the specific assets involved.
How to Measure Crypto Correlation
You don’t need a PhD in statistics to understand correlation, but you do need to pick the right tool for the job. Different methods capture different aspects of market behavior.
The Pearson Correlation Coefficient
This is the industry standard. The Pearson correlation coefficient measures linear relationships between two variables. It’s widely used because it’s straightforward and mathematically rigorous. For most retail investors looking at daily price changes, Pearson is sufficient. It tells you how tightly two prices hug a straight line when plotted against each other.
Spearman Rank Correlation
If the data is skewed or doesn’t follow a normal distribution, Pearson might give you misleading results. That’s where Spearman rank correlation steps in. Instead of looking at raw values, it looks at the ranks of the data points. It’s better for identifying monotonic relationships-meaning, does one variable consistently increase as the other increases, even if not at a constant rate? This is useful for crypto because price spikes often create non-linear outliers.
Kendall’s Tau
Another non-parametric option, Kendall’s Tau, is particularly robust for smaller datasets or when there are many tied ranks. While less common in general trading discussions, it provides a nuanced view of concordance between pairs, making it valuable for deeper academic analysis or specialized algorithmic trading strategies.
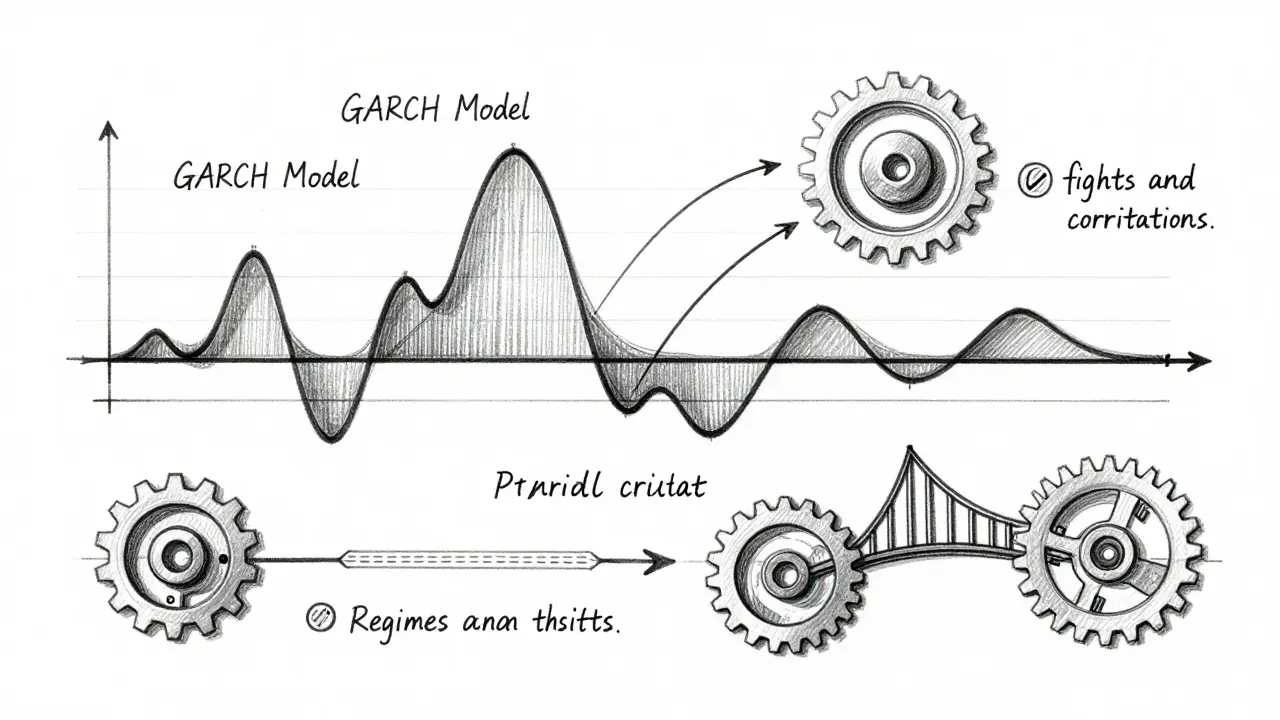
Advanced Dynamic Models: GARCH and EWMA
Static correlations (like a simple 30-day Pearson) assume the relationship stays the same forever. It doesn’t. Markets change. During a crash, correlations often spike toward 1.0 as panic selling hits everything equally. To capture this, professionals use dynamic models.
- GARCH Models: Generalized Autoregressive Conditional Heteroskedasticity models help estimate conditional variance, allowing for correlation estimates that adapt to changing volatility over time.
- DCC-GARCH(1,1): This is a state-of-the-art approach that produces correlation estimates responsive to market regime changes. It’s complex but highly accurate for institutional-grade risk management.
- EWMA: Exponentially Weighted Moving Average models give more weight to recent data points. This helps smooth transitions between different correlation regimes, providing a more responsive picture than simple historical averages.
Real-World Examples: BTC and ETH
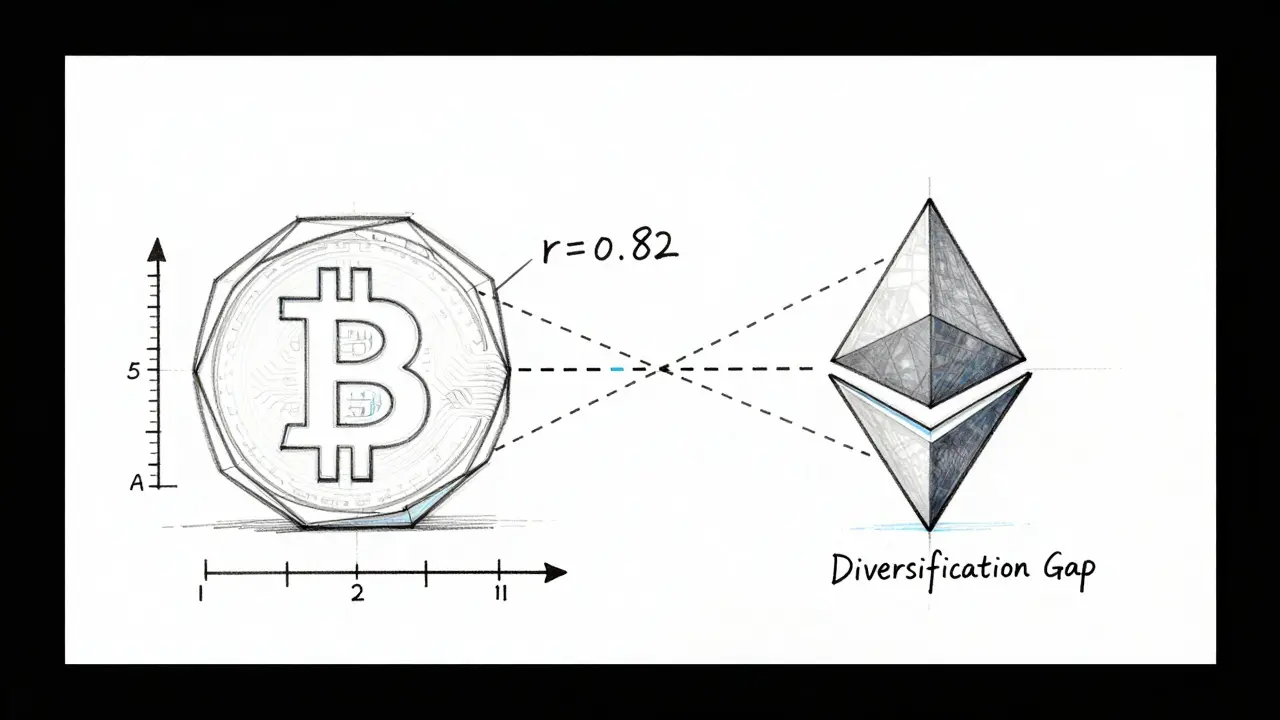
Let’s look at the two biggest players: Bitcoin (BTC) and Ethereum (ETH). Historically, they have moved very closely together, but the intensity shifts.
Data from early 2023 showed a 24-hour correlation of 0.82 between BTC and ETH. Over a two-year period, that number was 0.83. But look closer at the six-month window: the correlation hit 0.90. What does this mean? It suggests that in the short term, the markets were tighter, moving almost as one unit. As you extend the timeframe, slight divergences appear. This pattern is common in crypto: short-term noise often masks long-term structural similarities, but during bull or bear runs, those similarities become dominant.
A broader analysis including BNB, Litecoin, Ripple, and Dogecoin reveals that while altcoins may decouple slightly during niche rallies, they rarely sustain independence from Bitcoin’s overall direction for long periods.
Crypto vs. Traditional Assets
One of the biggest questions for investors is: "Does adding crypto actually diversify my stock portfolio?" The answer depends on what kind of stocks you hold.
Research comparing crypto to traditional mutual funds and ETFs shows an interesting split. Growth funds have a stronger correlation with Bitcoin than value funds. Specifically, small-cap growth funds had a correlation coefficient of 0.41 with Bitcoin, while small-cap value funds sat at 0.35. Mid-cap and large-cap categories followed a similar trend.
Why does this matter? Because traditional growth stocks are highly sensitive to interest rates. Crypto has shown weaker sensitivity to these same rate dynamics. This means that while crypto isn’t a perfect hedge, it can act as a partial diversifier against the specific risks that plague tech-heavy equity portfolios. Meanwhile, traditional mutual funds show much higher internal correlations-for example, mid-cap value and small-cap value funds correlated at 0.97. So, swapping some highly correlated stocks for crypto might actually improve your portfolio’s efficiency.
| Asset Class | Correlation with BTC | Note |
|---|---|---|
| Small-Cap Growth Funds | 0.41 | Moderate positive link |
| Small-Cap Value Funds | 0.35 | Weaker link than growth |
| Ethereum (ETH) | 0.82 - 0.90 | Highly dependent on timeframe |
| Mid-Cap Value vs Small-Cap Value | 0.97 | Traditional assets correlate more internally |
Temporal Dynamics: How Correlations Change Over Time
Correlation is not static. It breathes. Academic studies using Markov regime-switching models have documented significant shifts in crypto correlations during major macroeconomic events.
For instance, research covering August 2018 to September 2022 found that correlation estimates among 20 different cryptocurrencies elevated significantly during and after the COVID-19 pandemic. Why? Because systemic shocks tend to unify market behavior. Investors sell everything at once, driving correlations toward 1.0. However, by late 2023, these correlations dropped back to pre-pandemic levels as markets normalized.
This implies that correlation is regime-dependent. You cannot rely on a five-year average to predict next week’s behavior. You must look at current market conditions. If volatility is spiking, expect your diversified crypto basket to act like a single asset.
Practical Implementation: How to Calculate It Yourself
You don’t need expensive software to start analyzing correlation. Here is a step-by-step workflow for any investor:
- Select Your Data Source: Use trusted providers like CoinMarketCap, CoinGecko, or Bloomberg. Ensure you have consistent daily closing prices.
- Download Historical Prices: Pull data for the assets you want to compare. Decide on your timeframe (e.g., 30 days, 90 days, 1 year). Shorter timeframes are more reactive; longer ones are smoother.
- Choose Your Method: For most users, the Pearson correlation coefficient is the best starting point. Use Excel, Google Sheets, Python, or R.
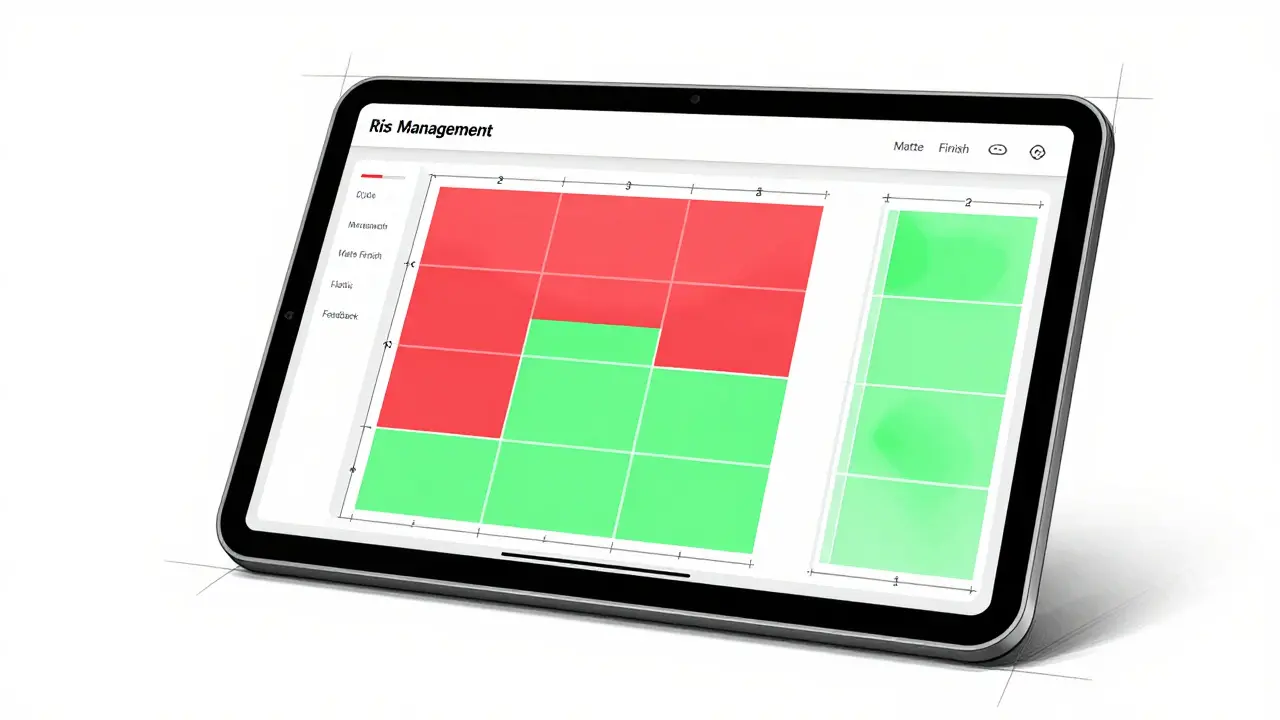
- Compute and Visualize: In Excel, use the
=CORREL(array1, array2)function. For multiple assets, create a correlation matrix. Heat maps are excellent for visualizing these relationships quickly, highlighting high-correlation pairs in red and low-correlation pairs in green.
Professional platforms like the Bloomberg Terminal offer advanced tools, but open-source libraries in Python (such as Pandas and NumPy) provide nearly identical functionality for free. The key is consistency in your data cleaning and calculation method.
Using Correlation for Risk Management
So, you have the numbers. Now what? The primary application is risk management. If you hold five different altcoins, but they all have a 0.85+ correlation with Bitcoin, you don’t have a diversified portfolio. You have a leveraged bet on Bitcoin.
To mitigate this, look for assets with lower historical correlations. This might include stablecoins (which have near-zero correlation with price action), certain decentralized finance tokens that react to protocol-specific news rather than market sentiment, or even non-crypto assets like gold or treasury bonds. By combining assets with low inter-correlation, you reduce the overall volatility of your portfolio without necessarily sacrificing returns.
Tactical allocation also benefits. When correlations weaken, it’s often a sign of market maturity or segmentation, creating opportunities to overweight specific sectors. When correlations spike, it’s a warning signal to reduce exposure or increase cash reserves.
Frequently Asked Questions
Is a high correlation bad for investing?
Not necessarily. High correlation isn't inherently bad, but it eliminates diversification benefits. If you believe the entire crypto market will rise, high correlation ensures you capture that gain. However, if you are trying to manage risk, high correlation is dangerous because it means all your assets will fall together during a downturn.
How often should I recalculate cryptocurrency correlations?
You should recalculate correlations regularly, ideally weekly or monthly. Because crypto correlations are dynamic and shift with market regimes, a 6-month-old calculation may be irrelevant today. Using rolling windows (e.g., a 30-day trailing correlation) helps keep your analysis current.
Can I find cryptocurrencies with negative correlation?
True negative correlation is extremely rare in crypto. Most assets move positively together due to shared liquidity and sentiment. However, some niche assets or stablecoins may show low or slightly negative correlations during specific market events, but these are often temporary anomalies rather than reliable hedging instruments.
What is the difference between Pearson and Spearman correlation in crypto?
Pearson measures linear relationships and is sensitive to outliers. Spearman measures rank-based monotonic relationships and is more robust to skewed data. In crypto, where price spikes are common, Spearman can sometimes provide a more stable view of the underlying relationship, though Pearson remains the industry standard for simplicity.
Does correlation imply causation?
No. Just because Bitcoin and Ethereum move together doesn't mean Bitcoin causes Ethereum to move. They are likely both responding to a third factor, such as global liquidity changes or regulatory news. Always interpret correlation as a measure of co-movement, not cause-and-effect.
Which tools are best for calculating crypto correlation?
For beginners, Excel or Google Sheets are sufficient using the CORREL function. For intermediate users, Python with Pandas offers more flexibility. Professional traders often use the Bloomberg Terminal or specialized crypto analytics platforms that provide real-time correlation matrices and heat maps.
How does market volatility affect correlation?
During periods of high volatility and market stress, correlations between cryptocurrencies tend to increase, often approaching 1.0. This phenomenon, known as "correlation breakdown," means that diversification benefits disappear precisely when you need them most. Understanding this dynamic is crucial for risk management.
Is correlation between crypto and stocks increasing?
Yes, over the long term, the correlation between cryptocurrencies and traditional equity markets, particularly tech-heavy growth stocks, has increased. This reflects the growing integration of crypto into mainstream financial portfolios and the influence of macroeconomic factors like interest rates on both asset classes.